June 6, 2022
After 9 Weeks of Red, Bitcoin Finally Goes Green
Dear Secret BTC Agent,
 |
| By Marija Matic |
Bitcoin (BTC, Tech/Adoption Grade “A”) made history when it posted nine consecutive red weekly candles for the first time. Fortunately, though, that streak was broken last week as Bitcoin closed higher at the end of the seven-day period.
This has created an “inverted hammer” candle, which is a positive sign. It means we should see plenty of green this week.
Bitcoin is now trading above the $31,000 resistance level and has a good chance of moving to test resistance at $34,000.
The broad market is in the process of healing from TerraUSD’s (UST, Stablecoin) demise, which prompted the largest ever inflows of BTC in USD value to exchanges. However, Bitcoin managed to stay above key critical levels — such as the 200-week moving average, which now sits at $22,027.
Furthermore, a record 66% of Bitcoin has not moved in over a year. This shows that while short-term holders capitulated, long-term holders’ conviction held stronger than ever.
But not all HODLers are the same. While it’s great for those who can to hold as they please, some have connected bills to pay. For example, miners sent almost 200,000 coins to exchanges in May to sell as their profit margins declined. These coins had a cumulative value of $6.3 billion, creating a substantial pressure on the price.
Other metrics show that futures have been trading at a discount for over six months. That’s the longest period of negative funding rates in crypto price history. In case you’re unaware of what that means, negative rates reflect negative sentiment and expectations of further declines.
Interestingly, another market indicator, open interest, has reached an all-time high, with 450,000 BTC on the line. Higher open interest means volatility lies ahead in the derivatives market.
While volatility may sound scary, it’s not necessarily a negative. It simply means price action can swing rather than stay steady. Whether it’ll ultimately be to the upside or downside is the question. What isn’t in question is the fact that lots of volatility is expected after the flat consolidation season runs its course.
Bitcoin has once again broken out of its trading channel to the upside as can been seen on TradingView’s four-hour chart:
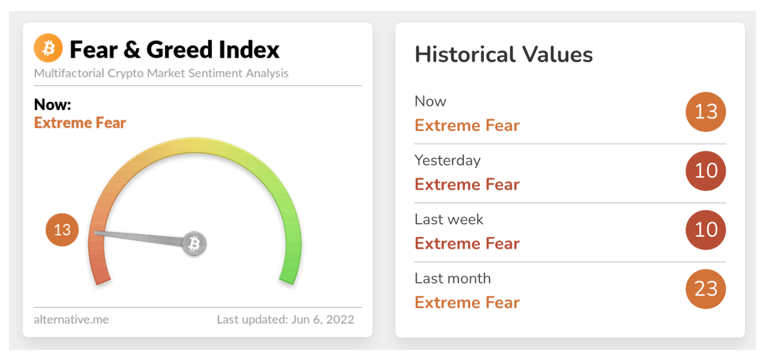
Meanwhile, the Greed and Fear Index continues to show “Extreme Fear” in the market:

Source: AlternativeMe
We’ve only seen this level of fear in three periods in Bitcoin history.
1. The crash from $6,000 to 3,000 in 2018/2019
2. The COVID-19 crash in early 2020
3. The May 2021 crash
The average length of all three saw Extreme Fear stick around for two months. And in all three instances, that fear was followed by growth.
Our current period of extreme fear started a month ago. And if history is anything to go by, it may last for another month before we see some of that growth.
Notable News, Notes and Tweets
• In Dubai, 29 shopping malls and 13 hotels will now accept Bitcoin in partnership with Binance and retail giant Majid Al Futtaim Group.
• Deepak Chopra: Crypto is in crisis, but investors need to focus on the long term.
• Are exchange layoffs the first sign of crypto winter, or is it already over?
What’s Next
Bitcoin’s chart has finally turned green after a long bearish streak as the market leader broke out of its trading channel to the upside. From here, it can either make a run for $34,000 or retest $30,600 first, like it did on June 1.
Either way, BTC needs to turn $33,000 into support before it can aim higher.
It helps that the supply of Bitcoin on trading platforms dramatically decreased over the past week. There are fewer coins to sell, which can help BTC gain steam after closing the first green weekly candle in ten weeks.
Keep checking in with Weiss Crypto Daily to monitor where BTC goes next.
Best,
Marija Matić

0 Comments:
Post a Comment